
Ok, so you’re moving to a microservices architecture. You’ve got a lot of things to think about when you’re increasing the number of moving parts within your system. Instead of one point of failure you now have a hundred points of failure! At Findmypast we use repository driven development to help manage the complexity of connecting our microservices to the many different centralised operations services we have in order to reduce the risk of operating a microservices architecture.
I’m a huge fan of Sam Newman’s principles of microservices which is a great set of guidelines when getting into the world of microservices. In this post I will cover how Findmypast applies two of the principles; making microservices highly observable and a culture of automation. Sam has also talked about having a superstructure that supports microservices which I’ll describe as well.
At Findmypast our superstructure is the glue that holds our suite of microservices together. Our centralised monitoring, logging, alerting, service discovery, service configuration, continuous integration, source control and feature toggling all make up our superstructure. These operations services help us to operate our microservices out in the wild and react to problems when things go wrong. However it’s a big responsibility for our developers to think about all these different operational services so we try to make it as easy as possible to hook up our microservices to the superstructure when our developers are creating new microservices. This is where repository driven development comes in.
To quote the blog from codeship
‘Repository driven’ means your developers never have to look anywhere except the code and the repo to test and release software. This is super efficient, allowing teams to stay focused on their code and their projects rather than maintaining CI/CD infrastructure.
We’ve taken repository driven development a little further and we’ve tried to capture all externally connected services within configuration files in the codebase of our microservice. This means that logging, monitoring, alerting, visualisation, infrastructructure, deployment and everything else is all connected up from within the codebase. In order to create a fully production ready microservice our developers can work solely within a single repository to configure everything required.
To make our services highly observable we have centralised logging through Graylog and centralised monitoring with Graphite and Statsd. After capturing this telemetry about our microservices we visualise it and alert on it. Our developers can write an alerts.yml file which gets posted into our service discovery mechanism underpinned by Consul. From there we use Consul-Template in order to generate alerts that get picked up by Icinga. Our developers can write a dashboard.yml file which will automatically generate a visualisation dashboard and it will pop up on our TVs dotted around the office.
Here is an example of an Icinga alert using graphite data generated the yaml config below.
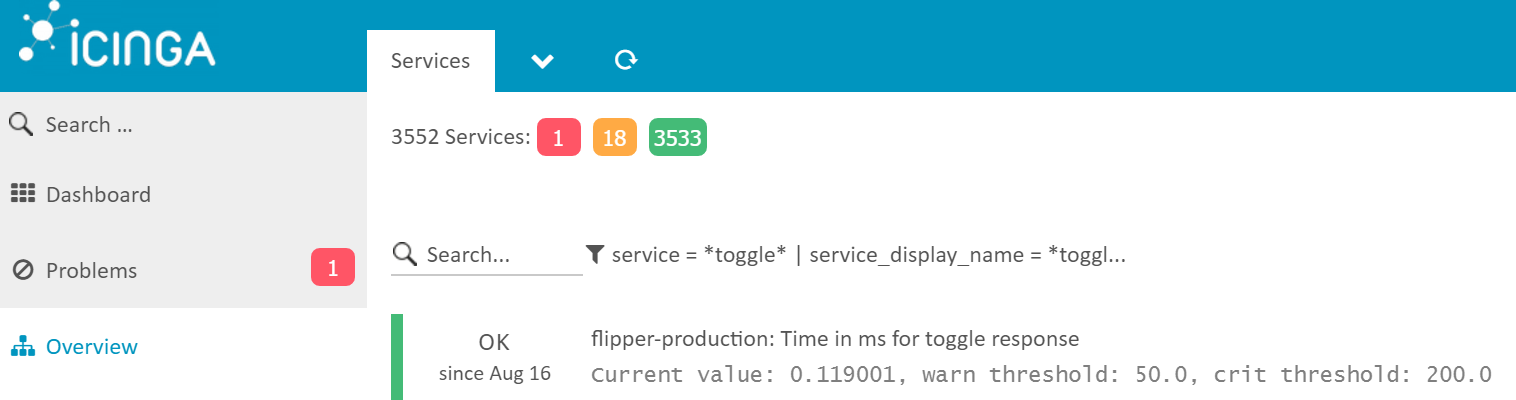
environments:
production:
host_address: flipper.example
graphite:
response_elapsed_time:
display_name: Time in ms for response
graphite_target: averageSeries(long.flipper.production._._.requestElapsedTime)
reverse: false
critical: 200
warning: 50
timespan: 30
This is one of our automatically generated dashboards using graphite data generated the yaml config below.
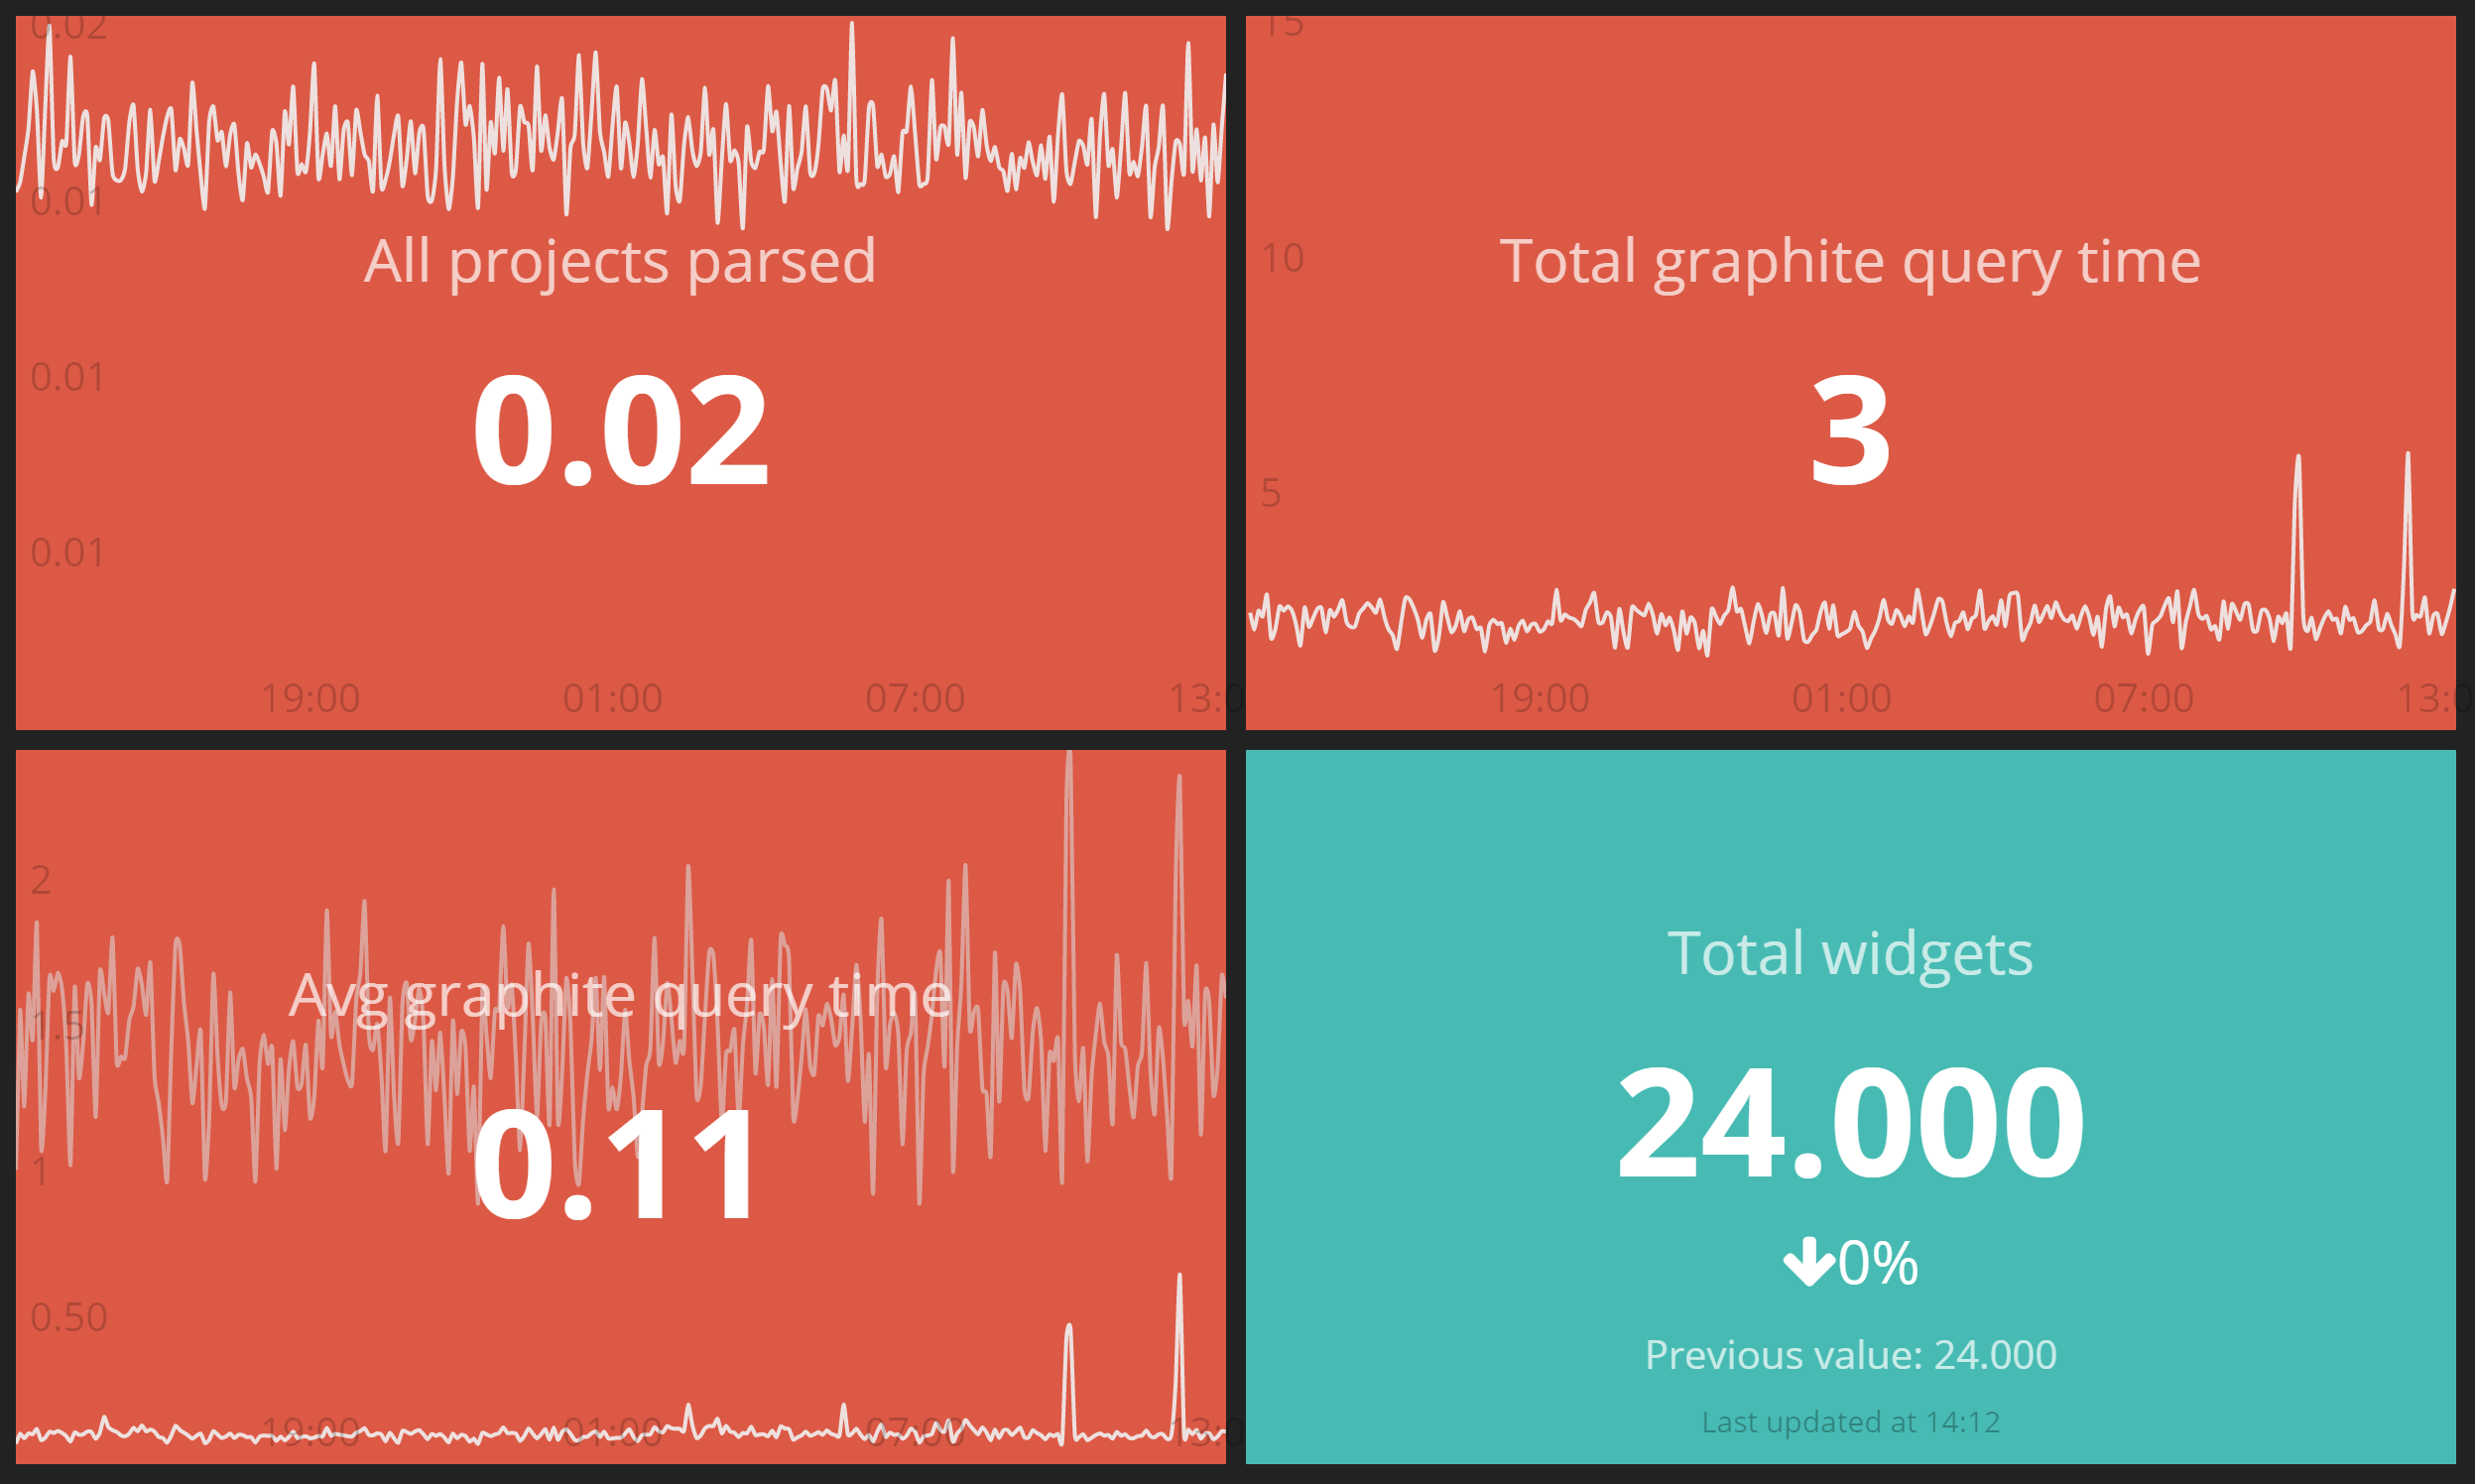
data_sources:
parse_all_configs_time:
key: summarize(long.dasher.production.parse_all_configs,"5min", "avg")
functions:

dashboards:
graphite_production:
title: Dasher Graphite Stats
widgets:
parse_all_configs:
title: All projects parsed
type: Rickshawgraph
width: 2
height: 1
properties: data-renderer="line" data-unstack="true"
measures:
parse_all_configs_time:
source: parse_all_configs_time
We’ve built a strong culture of automation within Findmypast and at the core of our new microservices architecture is Docker. This has sped up our delivery pipelines which are now running under five minutes for a complete test and deploy cycle for all our new microservices. In these codebases we’ve been able to fully adopt continuous delivery and trunk based development. In addition to those benefits it has enabled easy spin up of our development environments in Windows, Linux and Mac so a boon for our developers. This is great when bringing in new developers as they’re mostly able to get a working environment on day one of working here.
The foundation of our new Docker infrastructure is the automatic provisioning and configuration of our Docker hosts with Puppet. Our operations team have worked tirelessly to make sure that provisioning isn’t a bottleneck and is easily repeatable. We have a bank of generic Docker hosts for testing and when we’re ready to go to production we can get a dedicated bank of hosts spun up the same day. It’s important to us that our developers can be as autonomous as possible.
We feel strongly about not programming in our continuous integration tool so we built Usher. We use it to stitch together all the various command line interface tools that make up our automation pipeline. This leads to deployment being as simple as the command usher run deploy. We can test everything locally before setting up our continuous integration pipeline to just plug in the simple commands to the continuous integration software. We also make use of Docker-Compose to describe the infrastructure and environment that we wish to deploy, run or test.
We have an automated service proxy that automatically surfaces our new microservices and allows us to route to them through the internal dns which means no more manually changing nginx configurations and dns entries. We’ve also been looking at Traefik as an alternative to our home grown automated service proxy which we think will plug in nicely. The best code is the code you don’t have to write!
dasher:
description: A dashboard view to be used by the visualization framework.
root-tag: production
This proxy configuration will generate a url similar to http://dasher.service-proxy.example automatically.
In order to decouple our deployments from our releases we use feature toggles. You have to be careful with feature toggles and make sure to clean up after yourselves but it’s well worth the effort. Our feature toggling infrastructure is built on top of launch darkly and it’s trivial to add in toggles with our ReactJs library reactoggles. When deployment stops being something you worry or even think about, you can start releasing at will.
toggles:

* name: Example toggle
  description: A description of a toggle
it’s a big responsibility for our developers to think about all these different operational services
It’s worth reiterating that point from earlier and it’s not something we want to burden our engineers with. The final tool I want to cover is an internal automation tool called Overwatch which addresses this burden. At it’s base it’s a Yeoman generator which allows you to create a skeleton application, have it pushed to github, have it automatically create a continuous integration project and pipeline, and finally have it hooked up to every system I’ve mentioned previously in the post. In this quarter we want to empower our engineers to go from a blank slate to a production microservice in under ten minutes.
All this adds up to a super efficient day-to-day development experience. We’re on a mission to remove all the day to day change work and let our engineers focus on delivering business and customer value rather than fiddle with half a dozen operations systems. Our goal is for our engineers to never have to look anywhere except the code in the repository they are working in to test, release and manage our software.
We build our software with NodeJs, ReactJs, Elixir and Phoenix. If you like the sound of what we’re doing here please apply as we’ve got positions open in both Dundee and London.