Contents
- Why Diagrams?
- Plant UML
- Sequence diagrams
- Activity diagrams
- Component diagrams
- How to write and edit diagrams
- How to generate diagrams
- Alternatives
Why diagrams?
I find that diagrams are a great way of visualising complex behaviours or systems so that anyone can understand them. In my experience stakeholders, product owners, project managers and other engineers can understand these more easily than a representation within text. We use them as reference when discussing requirements in either architectural or project meetings.
Our designers do mock ups to get quick feed back on various designs of our user interfaces. System diagrams are akin to programmer mockups for how the final system will behave. This can have some nice benefits as problems can be spotted early for little effort with tools, as I’ll show below.
One more benefit is when new engineers join an ongoing project. If an API or a service has a set of diagrams that describe the important functions of that service then it makes the onboarding experience a lot smoother than having to dig through the code to get an idea of what’s going on.
Plant UML
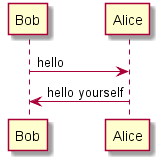
Plant UML is a great open source tool for creating various architecture diagrams. They provide a domain specific language for generating diagrams. Here’s a small example of the syntax.
@startuml
Bob->Alice : hello
Bob<-Alice : hello yourself
@enduml
Which results in this sequence diagram

I recently come across it after looking around for a few different ways to work on diagrams as a team. We tried various diagramming software like Visio and Google Docs diagrams but none of these worked well for sharing within an engineering team. I went looking for a new tool with two things in mind: The diagrams should live in the code repository, and the diagrams should be text based so that the team would get the benefit of diffs and version history.
Plant UML is a good fit for those two requirements and it also has the widest selection of diagram types available that I’ve found. So far we’ve used sequence diagrams, component diagrams and activity diagrams. I’ll give examples below.
Component diagrams
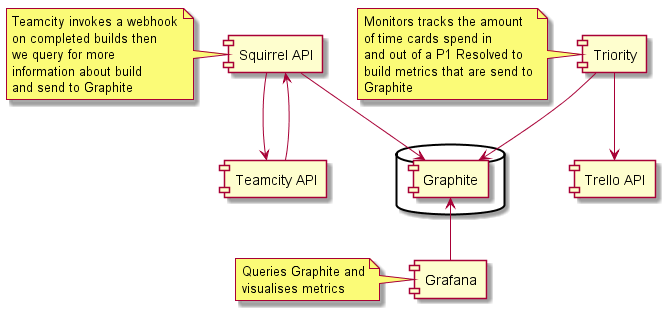
Component are great for system architecture diagrams.
This diagram shows a high level representation of how our metrics gathering system works. We track things like the lead time between code being committed to code being released to customers.

Sequence diagrams
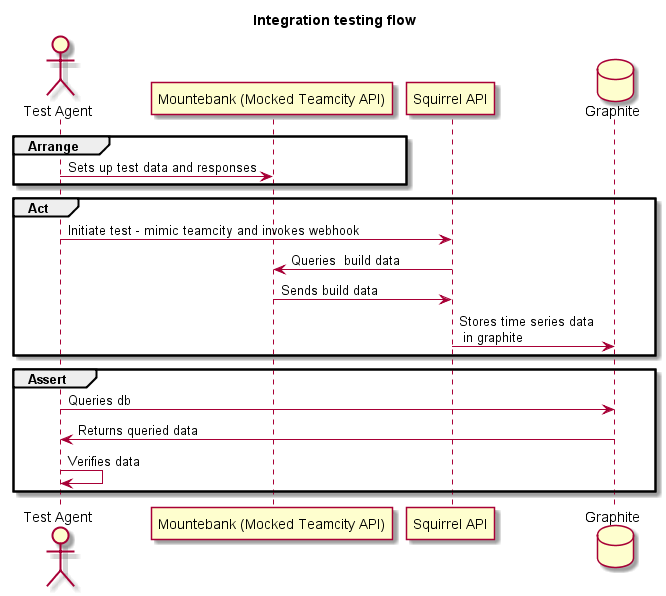
Sequence model interactions between various actors within a system.
What we see below is how we perform tests at an integration level and the different interactions between the different components within the system.

Activity diagrams
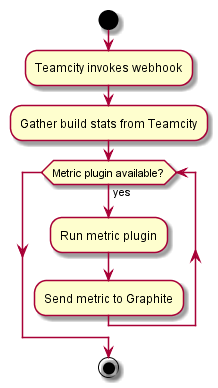
Activity is like a logic diagram
This shows us performing a while loop, while plugins are available and generating metrics.

How to write and edit diagrams
I write my diagrams in plain text using Atom. There are two PlantUML packages that I use:
- PlantUML language for syntax highlighting
- PlantUML viewer for realtime diagram preview as you write
How to generate diagrams and show them in a Github repository
Once you’ve written your diagram you’ll want to be able to generate your diagram images and make them available.
To automatically generate the diagrams I created a node module called diagram-cli. Below are instructions on the dependencies you need in order to use diagram-cli.
# You need to have graphviz installed to generate diagrams
# if you're a windows guy
choco install javaruntime
choco install graphviz
choco install nodejs.install

# you then need to install the diagram-cli module
npm install -g diagram-cli
Once you’ve got that all installed you’ll want to go to the root of your repository and type the following commands
# this will create a diagrams folder with the folders you'll need
diagrams init

# running this command will then generate your diagrams
diagrams make
In your front page readme file of your github repository add a link like this
#### Diagrams

Here is a [link](./diagrams/README.md) to some diagrams
In your file ./diagrams/diagrams.yml you can change your project name and also add additional properties that will be available in the handlebars file that is used for generating the README file.
Alternatives
While looking around I found several alternatives to PlantUML. There’s some great options here.
- Mermaid is pretty cool - they do flowchart, sequence and gantt
- js-sequence-diagrams these look really nice!
- flowchart.js looks great for flow charts!
- There’s also this blog post which has quite a few other alternatives