

Findmypast (FMP) released the 1921 Census of England & Wales at midnight on Jan 6th 2022 to an eager community of genealogists. The preparation of the census - preservation, digitisation and transcription took three years of hard work. Aside from the data preparation, we also had technical challenges to address. Specifically, could our services deal with the projected increase in users for the first few days of 1921 launch period?
This post is the third in a series that details how we approached scaling our service to deal with a projected day one 12x increase of users.
Digging deeper into the infrastructure
We left the second blog post in a poor position, our scaling efforts were not going well; network timeouts and throughput issues dogged each and every one of our stress test game days. At this point, we started to suspect the issue was related to hardware rather than the services. We started to dig deeper into all layers of the network stack, along with looking at the new Hyper-V hardware.
Before we dig too deeply into the things, lets recap on our existing hardware setup.
- For the search backend, we use SOLR with a cluster of bare metal machines to index and retrieve search results. This was one area where we knew in advance that we needed more resources, so we scaled the cluster into AWS for extra compute.
- The majority of the Findmypast service runs on K8s, but not on bare metal. The K8s cluster is composed of Linux virtual machines running on Hyper-V.
- Our Hyper-V setup consisted of two clusters of bare metal machines, however both clusters were running different versions of Hyper-V
- We also have some areas of the site still running Windows servers with a Microsoft .Net/C# stack with SQL Server backend. These are also virtual machines running on the same Hyper-V hardware.
- The internal services, staging environments, etc also run as virtual machines under Hyper-V.
So, SOLR aside, Hyper-V managed pretty much everything, from our internal deployment process to the production website.
The networking layer was particularly gnarly. The diagram below shows (I hope!) most of the virtualised layers involved in networking.
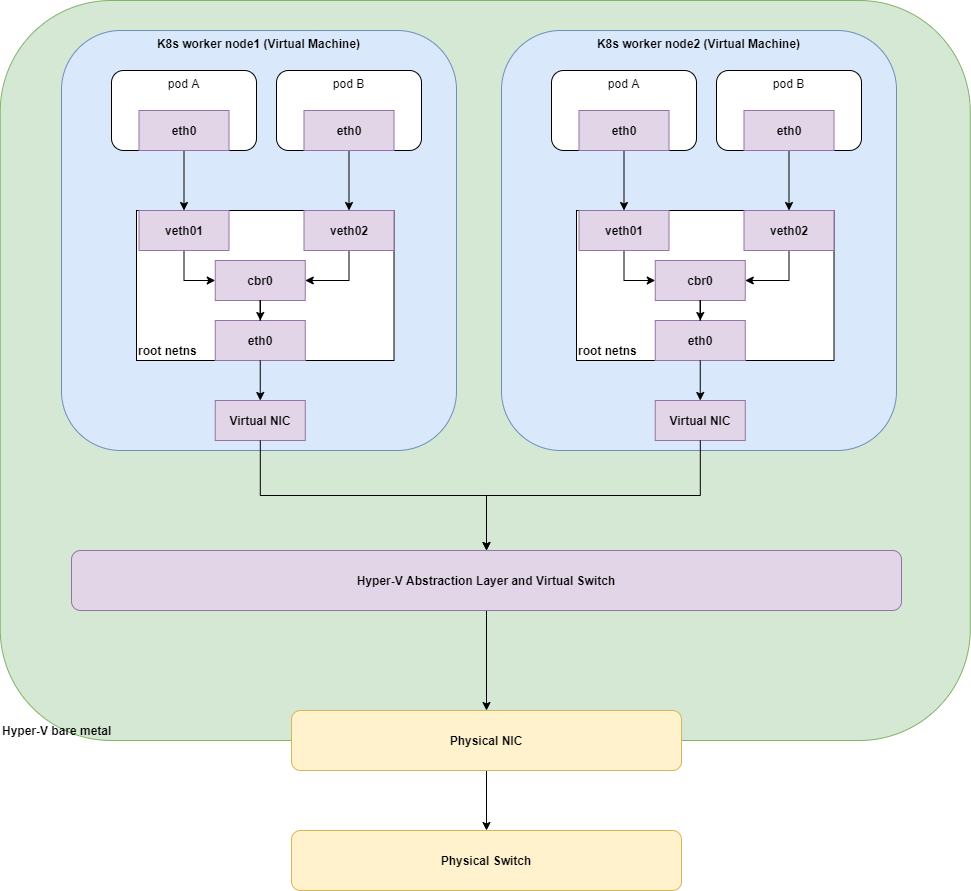
From the bottom up we have the physical hardware, the switch and the cables that make up the connections to the internal network and to the internet. Further up, we have the physical network interface card (NIC) and the bare-metal Hyper-V server. Everything above that is virtual, the Hyper-V abstraction layer sits between the virtualised network in tne virtual machines and the NIC. Inside the VM, we then have the complexities of Kubernetes networking. It’s a complicated setup and digging into where the bottleneck was wasn’t going to be easy.
We attacked this problem on several fronts:
- We brought in Kubernetes consultants to give our K8s cluster a health check and also for their networking experts to sit in on our stress test and monitor the system for potential issues.
- Investigated using kubectl-trace to run bcc within the K8s cluster. This allowed us to instrument areas like DNS lookups, Round Trip Time (RTT), software interrupt requests (softirq), etc at run-time with no code or deployment changes. While useful, we didn’t really get the most out of this tool.
- Dug deeper into the Hyper-V CPU scheduler to tweak the virtual CPUs assigned to the K8s nodes.
- Removed unnecessary Istio components like the Istio proxy sidecar. The Istio Prometheus setup also wasn’t fit for production - it was using way too much of a worker nodes CPU and memory.
kubectl-trace was interesting, it allowed us to instrument a pod in real-time using a variety of bcc tools. Here’s an example of tracing RTT requests to/from a K8s pod. (Note that this is showing a histogram for just one remote address. The real output produces a lot of data for all the IPs received by the pod.)
# ~$ kubectl trace run K8S_WORKER_NODE --tracer bcc --program tcprtt -a --args "-a10.244.14.104" --args "-B" --args "-d60"
Remote Addres = 10.110.187.38
     usecs               : count     distribution
         0 -> 1          : 0        |                                        |
         2 -> 3          : 0        |                                        |
         4 -> 7          : 0        |                                        |
         8 -> 15         : 0        |                                        |
        16 -> 31         : 0        |                                        |
        32 -> 63         : 0        |                                        |
        64 -> 127        : 0        |                                        |
       128 -> 255        : 0        |                                        |
       256 -> 511        : 0        |                                        |
       512 -> 1023       : 0        |                                        |
      1024 -> 2047       : 0        |                                        |
      2048 -> 4095       : 359      |************************                |
      4096 -> 8191       : 596      |****************************************|
      8192 -> 16383      : 384      |*************************               |
Requests to/from the pod were taking between 2ms and 16ms. While useful, we really needed an easier way to visualise the large amounts of data being produced. For example, the Remote Addres in the example above could either indicate the source IP of a service calling this pod, or the IP address of a pod being called from this pod. At first glance, it’s not easy to see which direction (incoming or outgoing) the RTT histogram is displaying. To use this information more effectively, we would need to write something to parse the output and expose it to Grafana in some way. It we had more time, we could have taken this further.
K8s itself exposes a lot of worker node metrics, including the Linux kernel softirq metrics which was showing us increased CPU usage on K8s workers nodes that were running on the new Hyper-V hardware. Increased softirq CPU could mean that the kernel is spending more time dealing with incoming networks packets from the NIC. (As an aside, during our investigation we found the Debugging Network stalls on Kubernetes post really helpful.) Moving those virtual machines back to the older hyper-V cluster reduced the softirq metrics back to what we would have expected. Clearly, something network related still wasn’t right on those servers.
Other odd things started to happen - while K8s didn’t report any memory pressure, the Hyper-V console was definitely complaining about out of memory errors. We increased the RAM to compensate. Perhaps oddly, we reduced the number of virtual CPUs (vCPUs) on the worker nodes from 24 to 16; we were seeing CPU scheduling issues from the hypervisor. Other fixes were required to iron out the scheduling problem, but those fixes meant that the virtual machines could only be run on the new cluster (running Hyper-V 2019) and could not be moved back to the older 2016 Hyper-V.
We also noticed that the new Hyper-V machines had elevated network errors compared to the other cluster. The NICs in these servers were the standard Intel NICs shipped with the server, they should have been up to the job. As a test, we had a Mellanox NIC lying around doing nothing and decided to use that in one of the newer Hyper-V servers and see how that performed against the other NICs. Bingo! That definitely made a difference, network errors reduced on that particular Hyper-V server and the K8s worker nodes hosted on that server also saw reduced CPU softirq usage. We went ahead and replaced all the Intel NICs with Mellanox NICs. The results were encouraging.
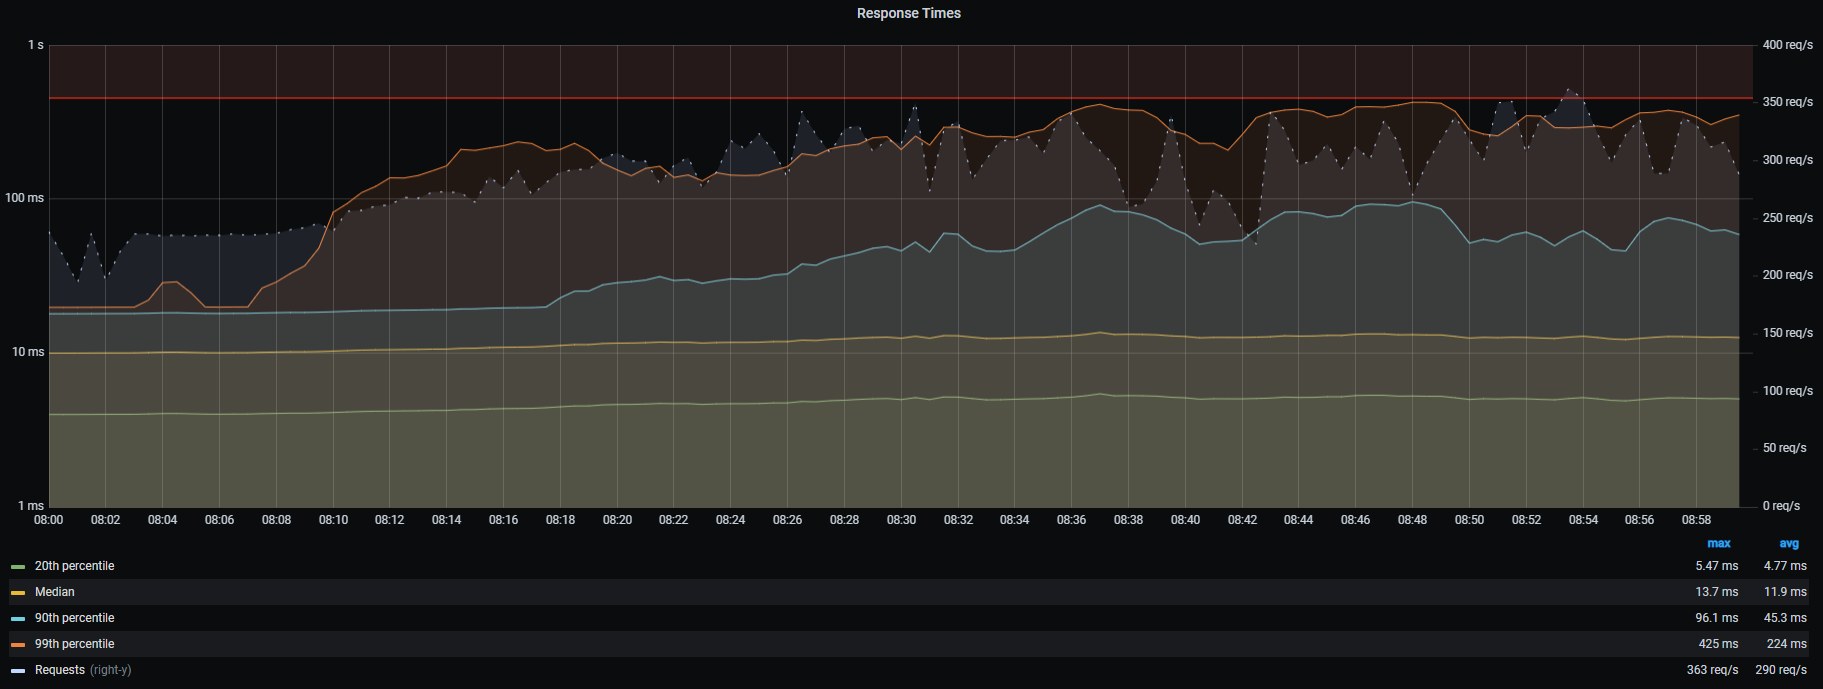
As an example, here’s a screenshot of a graph that shows the percentile performance of a service during a daily load test. This was taken before we changed the NICs. Note the 90th & 99th percentile, in particular, are pretty slow and very noisy. Throughput (the dotted line) is also noisy:
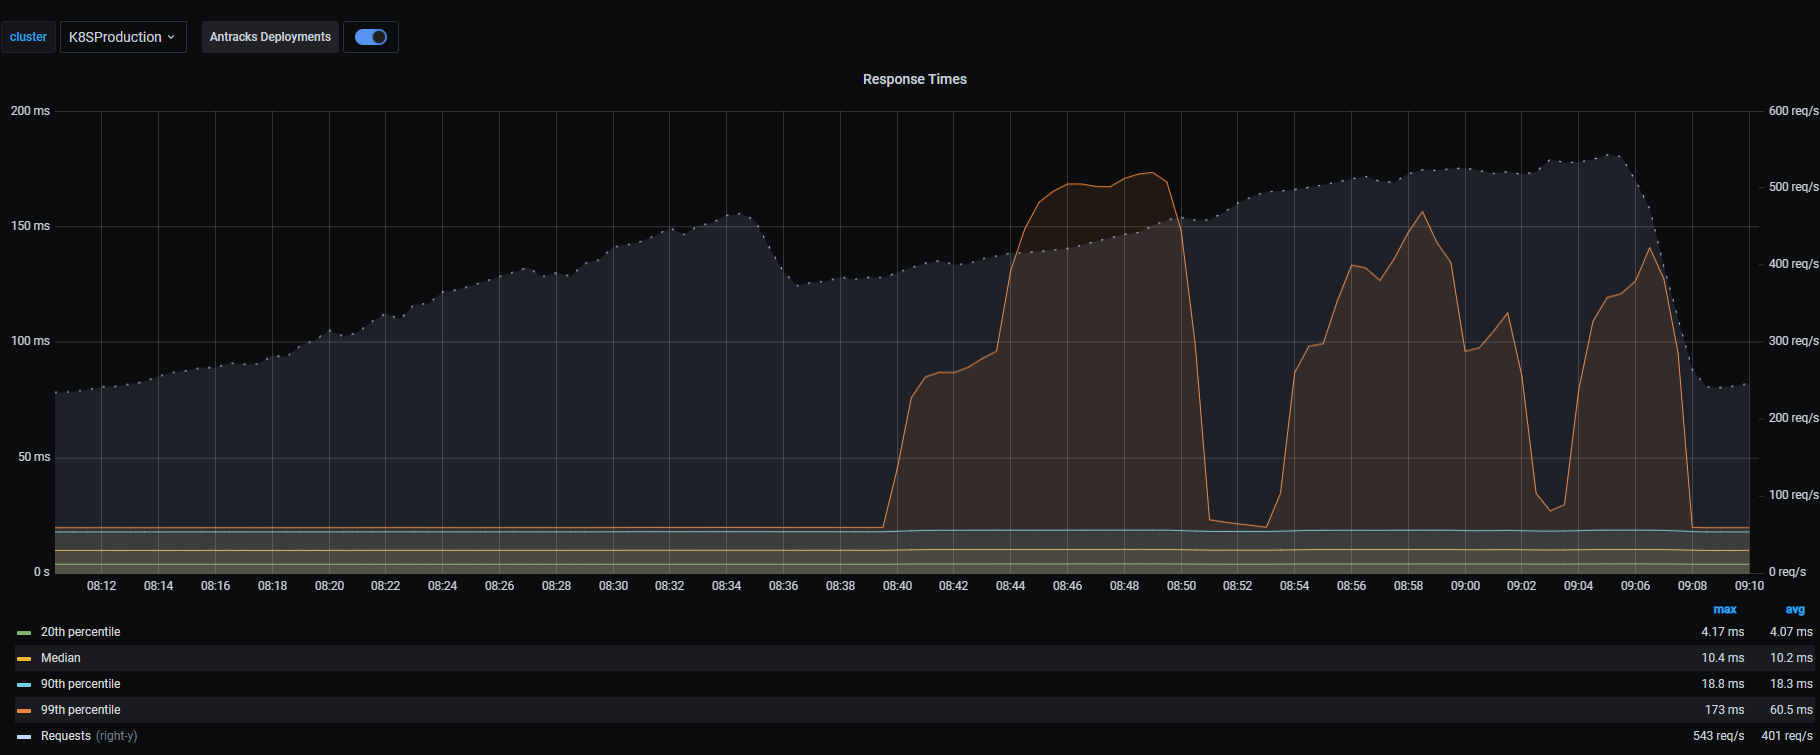
Here’s the same service, same time of day, same load test being executed but after the new Mellanox NICs are installed. While the 99th percentile spiked, the other percentiles pretty much flatlined. Throughput had increased and the graph is smoother - it was obvious now when load ramped up and back down again. (FYI, during 1921 launch day, this particular service had a 99th percentile average response of 23ms with a median average of 10ms, so the 99th percentile spikes shown here were ironed out before launch day.)
A light at the end of the tunnel
By the middle of November we had replaced the NICs and also upgraded our aging network switch. The next stress test game day we ran was much better at least as far as the network side of things was concerned. Network timeouts were greatly reduced and that increased overall throughput within the system. Of course, increased throughput then surfaced other issues that were hidden due to the network woes.
We continued with running stress tests twice a week, each run identifying more issues to be addressed. Some issues we identified were:
- Searching was still causing us some issues. We nailed down the problems to our Riak servers struggling. Increasing the servers helped distribute the load. And, our servers that served images were on an old 1Gb network which was congested during load. Moving that to a 10Gb network solved that particular issue.
- In the first post, we discussed a service called Antracks which was contributing to increased load by repeatedly hitting a number of REST API endpoints. We retired Antracks at the end of Nov and its replacement - using Kafka events to glean the data it required - greatly reduced load on other services.
- Our K8 consultants produced a K8s readiness report which, on the whole, was positive. They identified that our K8s CNI software - Flannel was out of date and needed replacing. We had already identified that as tech debt to be tackled after the 1921 launch.
- Our internal servers run on the same Hyper-V hardware as the production site. In theory, Hyper-V should be able to run any virtual machine on any server. However, while some of our stress testing was generated externally via BlazeMeter, other services, those that didn’t have any public facing endpoints, were tested using internal tooling which executed on our staging K8s cluster. The stress test themselves consumed a lot of CPU on the staging cluster, which in turn restricted the available CPU to be allocated to other VMs on the Hyper-V server. Long story short, the stress tests themselves were contributing to CPU resource contention on the Hyper-V servers. We solved this problem by segregating the production services from the internal support services. The production virtual machines stayed on the new Hyper-V cluster and we moved the back-end / internal services onto the older Hyper-V cluster. (Actually, there was a lot of virtual machine balancing taking place to ensure that we didn’t overload a Hyper-V server unnecessarily.)
- We use NGINX to route traffic into the Findmypast service from the internet. Under load, we managed to reach the magic number of 65535 ports allowed for one of the IP addresses configured on the server and hit port exhaustion. This was due to a mis-configuration which was easily solved.
- The NGINX server was also using a lot of CPU resource, we decided to add another NGINX instance and balance the traffic between the two, helping to distribute the load.
- We discovered that some K8s services were using the incorrect service addresses when talking to other services. For example, let’s say we have a service called
Sphinxthat needs to call another service calledFlipper. If both services are inside K8s then the service addresses are simply named after the service. e.g.:Sphinxcan make a call out tohttp://flipper/whatever. Services inside the K8s cluster use the cluster DNS to resolve service names. However, we also have services outside of the K8s cluster that sometimes need to call into the cluster to use a service. In that case we use an internal FQDN, something likehttp://flipper.production.service. These addresses are resolved using a DNS service outside of K8s. (Obviously!) Some services inside the K8s cluster calling other K8s services were using the longer FQDN to talk to the service. This effectively meant that traffic between the two services was routed out of K8s to a reverse proxy which then routed back into the K8s cluster. Replacing those incorrect service names also helped reduce network traffic and increase throughput. - We spent considerable time digging into and updating older C# code that was still an essential part of the Findmypast service but had not been seriously maintained for a few years. Instrumenting that code, optimising, pruning dead code and dealing with tech debt took more time than we anticipated.
-
Most of the microservices running in our K8s cluster are written in Node.JS. CPU intensive operations within a Node.JS service can seriously affect performance by blocking the event loop. We did see a correlation between pods reporting high event loop lag and failing liveness probes. The liveness probe failure would eventually teardown and re-create a new pod. High event loop lag also accounted for slow throughput for a service. The higher the event loop lag, the longer it takes for Node.JS to process other events, like a callback event that fires when a HTTP request completes. If the event loop lag is blocked for, say 200 ms, then no callback function will be executed for at least 200ms. Anything measuring the time taken to get a response from an API endpoint will report a time taken of > 200ms even if the actual network request is a lot faster. I suspect the reason why some services were reporting long response times from other services could be partly down to high event loop lag.
That begs the question as to why some services had high event loop lag, or even why only some pods had a high event loop lag and not pods from the same service. We suspect a few things here, but we did see correlations between worker nodes with high CPU usage and pods on those nodes with higher than expected event loop lags. Perhaps the service was being starved of CPU. (Note: We removed CPU limits on the key services to avoid the pods being CPU throttled.)
Phew! By mid December our stress tests at 12x our anticipated load were running well on the production site, no customer complaints even under high load, searching was solid and while each game day exposed another issue, these were at least easily identifiable and relatively easy to fix. It took longer than we expected or wanted, but we were good to go for launch day.
Launch day
So, how did the site perform on launch day? We launched at midnight on Jan 6th 2022 with a large number of genealogists logging on to search the census. After the first couple of hours it was clear that we were seeing problems with the deep zoom images. (These images allow us to zoom into and out of a high resolution scan of the census pages). We quickly identified that the issue was with the servers that feed these images back to the browser. We saw unexpectedly high usage of CPU, something that we didn’t see during our stress testing. Increasing CPU and adding more servers to distribute the load didn’t help. Further digging revealed that a small number of the 1921 images were encoded differently. It was the processing of that encoding that ended up eating CPU and memory. Why didn’t we catch this earlier? Our stress testing against the production was against existing search indexes and images. The 1921 data was not exposed on our production site; in fact it was a legal obligation to ensure that data wasn’t published until Jan 6th. Because of that, we missed the difference between the way the images were encoded for 1921.
Once that problem was solved it was plain sailing all the way, with very little in the way of performance problems during the first few days of launch. That early morning blip aside, the service scaled nicely to accommodate not only the large increase in users but the spikes in users brought to the site after TV and radio coverage of the launch.
Summary
The engineering teams all put in a lot of effort to the scaling initiative during the run up the launch day, having to deal with frustrating issues that were outside of their immediate control (hardware and networking issues). We have a great operations team that understood the network, the hardware and Hyper-V and the success of the launch was to great part down to them.
The take home is question everything and instrument everything. Look at the data and let that lead you to the root cause. At the start of this process we would have never guessed that we’d need to change the NICs!
We continue to stress test our service on a monthly basis. While our traffic is back to seasonal norms, we want to make sure that the service is still able to scale up when required. Regular stress (and chaos tests) build re-enforce the message to the engineering teams that performance and reliability is integral to our software engineering practices.
Get in touch
We are always looking for engineers to join our team so if you’re interested contact us or check out our current vacancies.