
Introduction
A key part of our product is the ability to build family trees on our site. To better understand how our customers are building and using the tree features we wanted to work out what sort of structure the trees generally have and answer questions like how many generations do users have? Do users follow their pedigree line, their parents, grandparents and so on or build out their other relations? Do users focus on a paternal or maternal line or both?
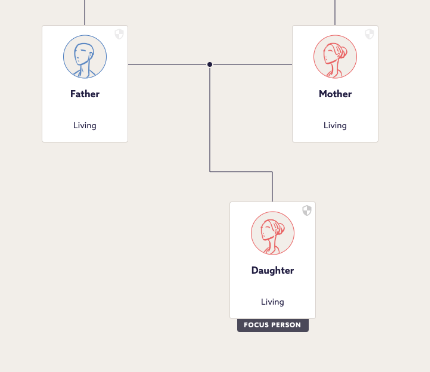
Trees can be quite complex structures with a lot of information contained within them. For example, a small tree with just a mother, father and daughter has 3 people but multiple relations depending on how you think about it.
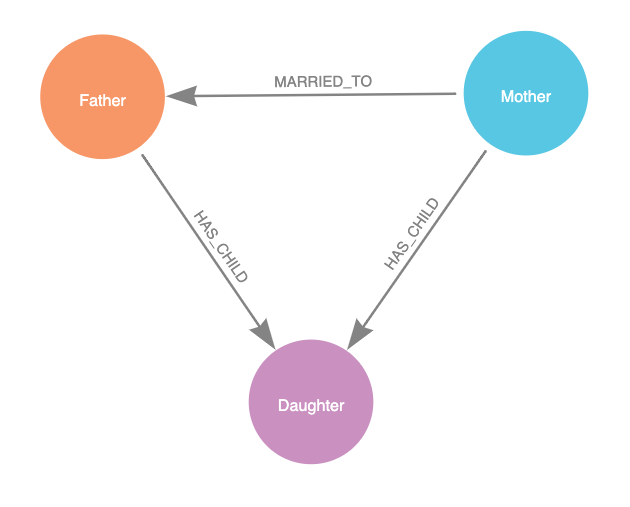
It could have 3 simple relations:
- Mother and Father are linked by a married relation
- Mother and Daughter are linked by a child relation
- Father and Daughter are also linked by a child relation
These relations can be expanded on to give direction information as well, in which case you end up with 6 relationships:
- Mother is married to Father
- Father is married to Mother
- Mother is parent of Daughter
- Daughter is child of Mother
- Father is parent of Daughter
- Daughter is child of Father
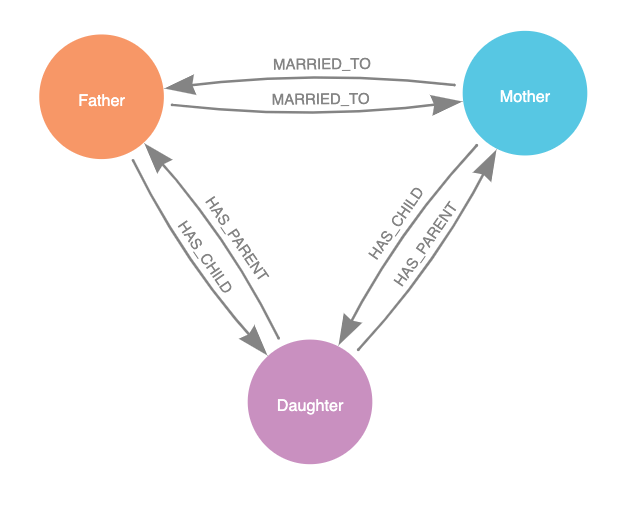
Adding in direction information has doubled the amount of relationships in the tree and this is before including other members of the tree and adding other relationships such as sibling relationships. Analysing this complex data is a challenge, how do we work out how many generations there are? How many people are in each generation?
To solve these problems we decided to use directional graphs, as this seemed the most natural way to deal with this data. In a directional graph, nodes are connected by edges with a direction. The example of the simple tree matches a graph well, each person is a node and each relationship linking people is an edge.
Calculating Generation Information
In order to use graphs to calculate the number of generations and the people within each generation, we need to perform a weighted shortest path algorithm. These algorithms calculate the shortest number of steps between each node using the weights as the length of each step, an edge with a weight of 1 will be preferred over an edge with a weight of 10. This is similar to how a sat-nav might calculate a car journey, you could take two roads one is straight and will take 10 minutes, the other is curvy and will take 20 minutes. So the sat-nav recommends the short road.
For our purposes a parent relationship has a weight of 1 and a child relationship has a weight of -1, all other relationships have a weight of 0. This means that the algorithm counts up the generations as it moves up older generations and removes generations if it has to go down a generation, but can freely move along relations in the same generation as it needs without changing the path length.
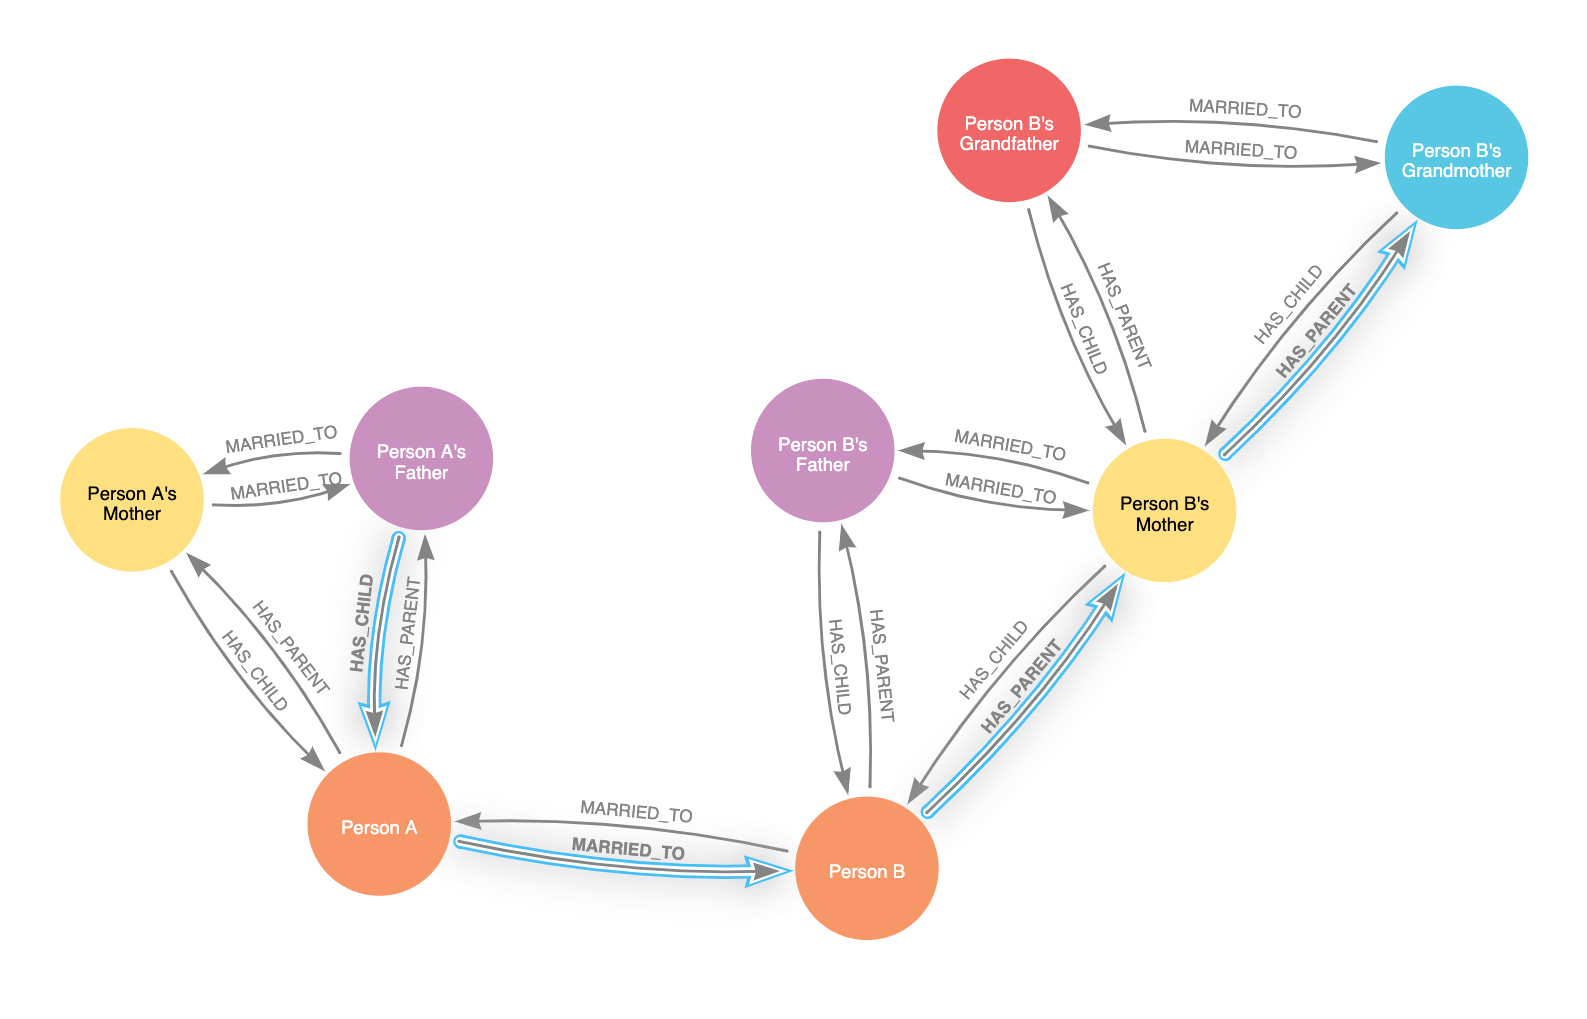
For example imagine a tree with a couple Person A and Person B. Person A only has their parents, Person B has their parents and grandparents. The path going from Person A’s father to person B’s grandmother is as such:
- From Person A’s father to Person A: Path length = -1, one generation down
- From Person A to Person B: Path length = -1 + 0 = -1, no change in generation
- From Person B to Person B’s mother: Path length = -1 + 1 = 0, one generation up back to the starting generation
- From Person B’s parent to Person B’s grandmother: Path length = 0 + 1 = 1, a generation above the starting generation
We do this for each pair of nodes in the graph, each person in the tree to every other person in the tree. This gives a matrix of generation distances from one person to each other person. From there we find the root node and set that as the 0th generation, all older generations are positive and all younger generations are negative. The root node’s parents are generation 1, the root node’s children are generation -1. A simple count of the number of times each generation occurs gives the width of each generation. The height is given by the difference between the maximum generation and the minimum generation plus 1 to account for the root node generation being 0. A tree with a root node, their parents and the root node’s child will have a height of 3, (1–1)+1=3. Now we have the information about the height and the width of the tree.
Pedigree Line Analysis
Using graphs in this way has an extra benefit, we can easily select the sub-graph that holds the root node’s pedgiree line. This means we can calculate the completeness of a user’s pedigree line, if they have both their parents, all 4 of their grandparents, all 8 of their great-grandparents and further back. We could use this to highlight the parts of the tree that are missing and maybe suggest where to look next to help them complete a generation in their pedigree line. Using this sub-graph we can also calculate the Ahenen number of each person in the tree. Ahnen numbering or ahnentafel is a system to number a person’s direct ancestors in a fixed sequence, starting at 1 for the person, 2 for their father, 3 for their mother. The rule for any father, f is:
- fn = 2n
and the rule for any mother, m, is:
- mn = 2n+1
where n is the Ahnen number for the child of the father or mother. We know the root node and the relations of each generation to the next, so we can loop through each generation and each person in that generation to calculate this number. This would also help us be able to indentify missing people in a tree and maybe prompt how to find them and where to look next.
Summary
We have implemented a way to calculate the height and width of trees created on our site with the aim of better understanding how our users build and use trees. This approach also enabled easy pedigree analysis, to understand if users aim to fill in their pedigree line and if there is a difference as a user becomes more experienced with the product.
Next Steps
The next steps for this work is to continue to analyse the data we have generated with this technique and hopefully inform and feed into new features for the tree in the future.
Get in touch
We are always looking for new ideas and collaborations so if you’re interested contact us or check out our current vacancies.