
Data Science at FMP
Findmypast is at the forefront of facilitating historical, and in particular, genealogical research. This has been achieved by embracing advances in technology that have allowed us to digitise vast quantities of records and make these easily available online. The result is a diverse user-base that covers everyone from advanced professional researchers through to those just starting out on their family history journey.
Recently, we have taken another stride forward by establishing a data science team who utilise advanced mathematics, statistics and machine learning to improve a user’s research experience. Can we help users who have a hit a brick wall in their research? Can we suggest the next record set that they should explore or the next search they should conduct? Can we help users glean information more easily from less structured texts such as newspapers?
This is the first in a series of blogs that will give an insight into what the Data Science team is working on and more importantly how that helps our users.
Network Science
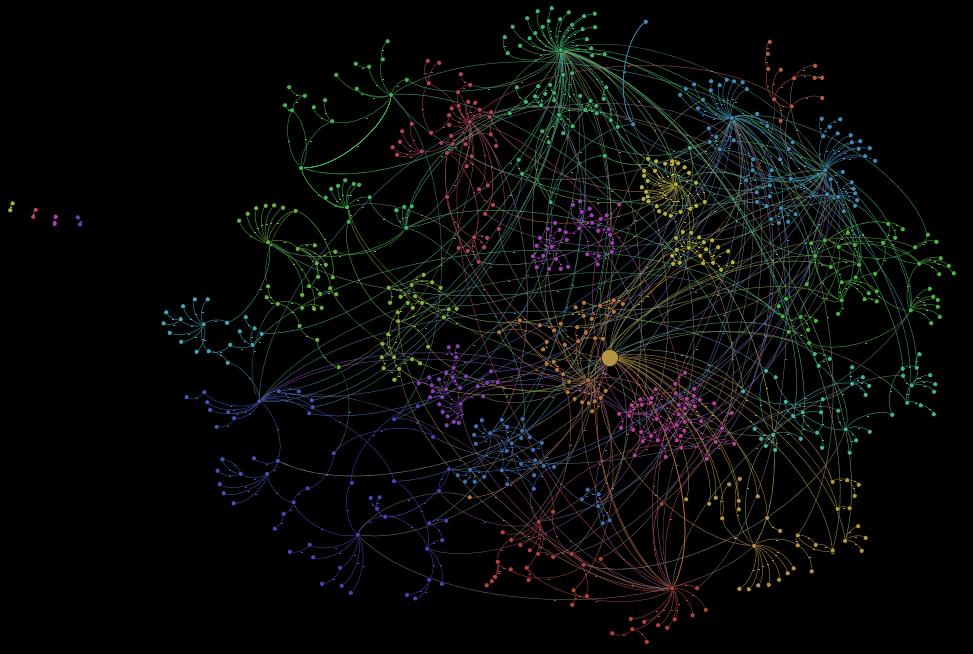
In simple terms, a network (or graph) is made up of nodes (vertices) connected in some fashion by a set of edges. The nodes can represent a variety of different real-world entities depending on the subject matter, for example people, places, animals, or neurons. The edges that link these nodes can be customised to represent different types of connectivity by introducing weighting or directionality. A path (or walk) through a network is a sequence of nodes and edges generated by traversing the network where the sequenced nodes and edges are incident to one another. In the very simple predator-prey (food chain) example below, the animals (and plant) are the nodes and the linking lines between them are the edges. The arrows on the edges indicate directionality, which in this example indicates who is the predator and who is the prey. For example, the rabbit consumes the plant as the arrow extends from the plant to the rabbit. An example of a path here is [Plant, Insect, Duck, Eagle], which links the plant node with the eagle node. However, those nodes are also linked by the path [Plant, Rabbit, Eagle] – analysing the differences between these paths gives us details on the functioning of the network.
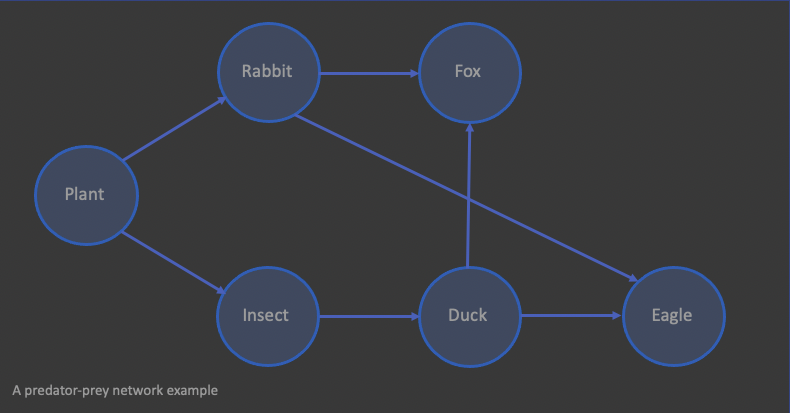
Mapping a path between two nodes and noting its measure and complexity provides a substantial amount of information about the network and thus, the real-world scenario it represents. For example, a social network may suggest a new connection between two users based on the strength of connections immediately surrounding those users in the network, or a streaming service may suggest a show to view based upon the strength of connection in a network created from user viewing history and preferences. In the predator-prey example above, changing the type of plant to attract a different type of insect will influence the strength and existence of the plant-eagle path. Attracting more insects will strengthen the bottom path, whereas selecting a plant that attracts no insects and isn’t consumed by rabbits breaks all plant-eagle paths.
At Findmypast we can model several different features as networks. The simplest is an individual family tree, which is a network made up of members of the family (nodes) and their relationships to one another (edges). However, we can also create networks using our tree-to-tree hint feature where donor and donee trees are the nodes and the hints themselves are the edges. Here, we can also adjust the granularity at which we view the network, for example, we can view it at a tree level, at a generational-level or at a person level. Another example is creating a network of places where the edges represent migration routes, birth locations or generational movement.
So how does creating and analysing these networks help our users? Understanding the relationship between tree construction and hint generation or the relationship between different places of birth (or death, immigration and residence) allows us to guide a user along their family history journey. For example, we can advise on the best strategies for building a tree quickly, advancing knowledge of a particular branch of a tree or what record sets to explore to find your ancestors. Moreover, we can help find the users place in the network allowing them to connect with distant relatives and enrich their family story.
As a company, analysing these networks allows us to highlight areas in the product where users may be struggling or assess the need for additions to our record set collection. It also lets us and the user supplement content with context, for example, whilst larger migration patterns are well understood, we can spot smaller patterns such as a migration from one town to another – analysis may lead to the conclusion that this was due to a major employer closing and this information can be shared with users across the network.
Currently, we are using network science to further our understanding of our Australian market. Australia is a nation with a relatively small population built predominately on migration. How easy is it for Australian users to build a family tree? How likely is a user to find ancestors who migrated to Australia? We’ll be providing the answers to the above and more in the coming months – watch this space! Overall, furthering our understanding of networks within the product will allow us to provide a richer, more engaging platform on which to conduct research.
Get in touch
We are always looking for new ideas and collaborations so if you’re interested contact us