Findmypast (FMP) software engineering practises and operational practices have changed considerably over the last few years. We’ve moved from a “classic” monolithic web service, where deployments to production were applied possibly weeks after the end of a sprint, to a microservices approach where we have continuous deployment to production and the majority of the FMP service is managed by Kubernetes.
The second blog post detailed the issues we encountered with our service discovery and deployment infrastructure. This third blog post continues the journey…
The Journey to Kubernetes
With our deployment and service discovery infrastructure in a reasonable state, the team could finally afford to spend some time getting on with the day job. However, the day job included improving the developer experience, making deployments easier, debugging easier, etc. We turned our attention to looking for improvements to make. At the time, our focus was not service orchestration tools like Docker Swarm or Kubernetes, but a more general problem; engineers were finding it hard to trace requests through the system, from microservice to microservice to microservice. Our logging guidelines specified that certain headers - including the correlation id - be added to every request so that these common headers can be centrally logged, in the hope that the logs can easily find all log entries associated with a specific user request.
In reality, not all services forwarded the headers correctly. Also, not all services added the correlation ID as a field to the log entry. Log entries, also, were sometimes not helpful, either the log entry didn’t contain any useful information or there were too many log entries, adding a lot of noise to the system. The team was focused on improvements to help engineers (especially the on-call engineer) to tracing requests through the system. Around the same time, the team were using their 1 day a week tech debt time to investigate orchestration tools like Docker Swarm. (FMP allow engineering teams one day per week to work on non-feature work tasks, such as fixing technical debt or investigation of new tools.)
On tech debt days we spent time installing and investigating tools like Docker Swarm, Nomad and Kubernetes. During these weeks, we actually looked at Kubernetes and rejected it as too hard to learn and focused instead on Docker Swarm. (We also installed and investigated Nomad for a short while). Outside of tech debt days, our focus on request debugging led us to OpenTracing. This looked attractive, it provided a visual means of tracing distributed requests through our system, along with metadata such as the URL request, status code, time taken for a response, etc.
During our investigation of OpenTracing, we setup a Jaegar server and updated a couple of our NodeJS microservices to support distributed tracing with Jaegar. The results were promising but a worry was that each microservice would need to be updated to support sending requests to Jaegar. It also added another external dependency for the microservice as well. We would also have to spend some time writing our own open tracing client in Elixir as well, since a number of our microservices were developed in Elixir.
Istio Service mesh
Around this time, we also came across Istio. This was a service mesh that sat on top of Kubernetes. A service mesh provides a whole host of goodness that extends the networking that comes with Kubernetes (and Nomad) with traffic management, policy enforcement and telemetry including distributed tracing and network visualisation tools.
The nice thing about Istio was that these services are pretty much invisible to the microservice. In fact, the only changes required by the microservice to support distributed tracing with Istio were to forward on certain request headers. After that, the logging of requests to Jaegar was handled by Istio. This approach was much more attractive - minor changes to the microservices were required, but we would get a bucketful of extra tracking goodness including service telemetry, network topology visualisation with Kiali, distributed tracing, fault injection (useful for chaos testing!) and advanced routing.
So, we had a choice. Go down the home brew approach and implement distributed tracing using our bespoke tools or move to Istio. The choice was pretty easy, were we thinking about orchestration tools anyway, so the choice to use Istio on top of Kubernetes was made. At the time, Istio was still in beta, but we figured that by the time we got a real Kubernetes cluster up and running Istio would have matured. (Also, we could pick and choose which bits of Istio we wanted to install - it wasn’t an all or nothing choice.)
Hi ho, Hi ho, it’s off to Kubernetes we will go!
We started down the path to Kubernetes quite slowly. We started with creating some virtual machines from our HyperV cluster and slowly went through the process of installing Kubernetes using the kubeadm tool. Progress was fairly slow at the start, the main issue was getting the networking within Kubernetes sorted out. Root causes of the issue was the Flannel manifest installed by kubeadm was out of date and the CNI plugin was also out of date. Once both components were updated, networking was working as expected and the rest of the installation went through smoothly.
We carefully documented each manual step required to create the cluster from a vanilla virtual machine and reproduced those steps over and over again until we had them nailed. The manual steps were used to automate the provisioning on the cluster using Puppet. By the middle of April 2018 we could spin up a Kubernetes cluster via Puppet. Initially we have 2 clusters:
- A playground cluster. That was used to try out news ideas, new tools, updates to deployment scripts, etc. We broke that one quite a lot, but it was easy to spin up a new one.
- A staging cluster. Clearly, before we even thought about serving live traffic via Kubernetes we needed a lot of testing. The staging server was used as our testing ground, not only for how Kubernetes performed, but a test bed for how we would migrate our existing microservices across to Kubernetes.
Our testing strategy was pretty straightforward:
- Update the deployment scripts for the microservices to deploy into the existing infrastructure as well as the staging cluster. We used Helm to deploy into K8s and our tools to scaffold up services was updated to add the Helm deployment scripts into a microservice.
- Use Consul to route traffic into both the old infrastructure as well as Kubernetes
- If all is well, route all traffic for the microservice into Kubernetes.
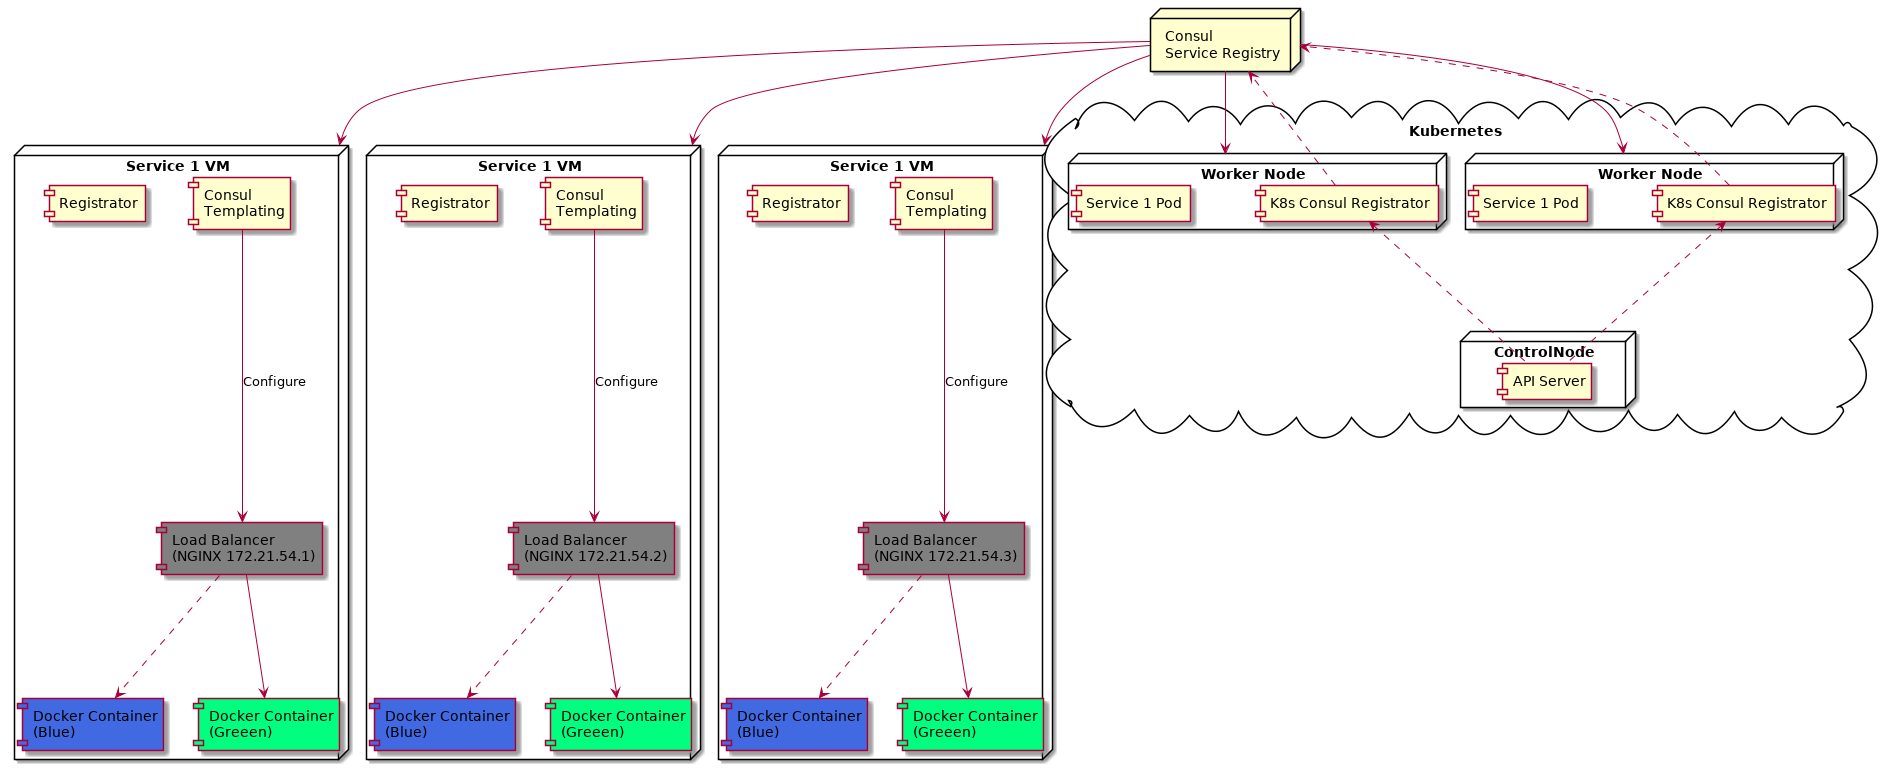
We migrated each of the services one-by-one, upgrading the service deployment scripts and testing how the service performed in Kubernetes. Our infrastructure diagram now looked like this:

In the diagram, we have a Kubernetes cluster. Two of the worker nodes in the cluster have the Service 1 pods running. They also have another pod which is a bespoke Consul registrator. This pod listens to API events from the control plane master node and, when a new service is deployed, registers that service with Consul. We have a Consul registrator running on each of the worker nodes (in reality these were nodes that handled ingress into the cluster). Kubernetes services then routed the request to a pod.
Actually, in the interests of making the above diagram clear, the reality is a little different. Recall from the last blog post that the load balancer is listening on port 3333 for the service. All microservices talk to each other on port 3333. In order to route into K8s, every load balancer not only has details about the containers running in its own VM, but also has knowledge of all the other service containers in the other VMs, as well as the IP addresses of the Kubernetes worker nodes. (Basically, the load balancer holds a list of all heathy microservice IP/ports registered in Consul). Each load balancer could route to any other container running that service, regardless of where the container was located. Requests hitting any load balancer would round robin between the service VMs and, of course, the Kubernetes nodes.
Another useful tool was Kubernetes annotations. In order for service traffic to be routed from Consul to the Kubernetes cluster, the registrator in Kubernetes would check the status/existence of an annotation that told it whether to register/deregister the service with Consul. By modifying the annotation, we could dynamically control whether the service (in Kubernetes) was registered in Consul. E.g.:
$ kubectl annotate service my-service fmp.register-consul=true --overwrite
would tell the Kubernetes Consul Registrator to register that service, while fmp.register-consul=false would de-register the service. This was incredibly useful during initial testing.
We could also route directly into the Kubernetes cluster - by-passing Consul - using a service address such as service1.integration.service.dun.fh. This would route directly to the service running in Kubernetes and the usual Kubernetes service configuration / pod configuration would ensure that the request was handled by a heathy pod in the Kubernetes cluster. The end game was to remove the old service.consul:3333 address and route directly into Kubernetes using the new service.dun.fh address. However, we couldn’t migrate over the new address until a microservice was completely divorced from Consul and deployed onto into Kubernetes.
Breaking up is easy to do
Once a service was stable within Kubernetes, we could start to de-commission the old service VMs and remove the dependency on Consul for service discovery. Decommissioning meant:
- Deleting the VM
- Updating the deployment scripts, removing the recently deleted VM from the deployment target
Once all service VMs were removed, the only route to the service was via the service1.integration.service.dun.fh Kubernetes address. This however, gave us a problem - not all microservices would have been updated to use the new address - in fact most still used the older service.consul:3333 address. We need a way to handle both the deprecated 3333 address as well as the new Kubernetes address. Recall that the 3333 address was routed via Consul DNS to a load balancer on the service VM, But, we didn’t have any service VMs any more, we switched them all off.
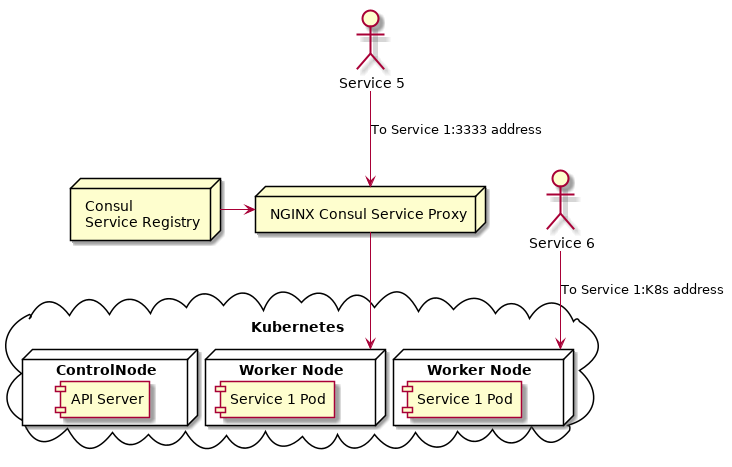
Our solution to that problem was to have a (temporary) NGINX proxy that proxied the 3333 addresses into Kubernetes. This NGINX proxy was registered in Consul, so as far as Consul was concerned it was just another service endpoint. The proxy stayed in place until all services had been fully migrated into Kubernetes and all services had replaced any 3333 URLs with the new Kubernetes equivalent. At this point, the infrastructure for a deployed service was a lot simpler:

In the example above, service 1 is fully within Kubernetes. Service 5 is talking to Service 1, but it’s still using the deprecated service.consul:3333 address. In that scenario, Consul (acting as DNS server for the service.consul addresses) returns to the service the IP of the NGINX Kubernetes Proxy. That in turn will proxy that request into Kubernetes. However, if Service 5 had updated it’s URLs to use the new Kubernetes address (like Service 6 in the diagram above) then Consul isn’t used and the request is routed directly into the Kubernetes worker node.
A couple of points to note here:
- The NGINX Kubernetes Proxy was only in place to support those microservices that hadn’t been updated to using the new address yet. Once all services had been updated, this proxy was switched off.
- The Kubernetes address of
service1.integration.service.dun.fhwas intended for those services outside of the Kubernetes cluster to access services inside the cluster. Calls to services within the cluster didn’t (shouldn’t!) use this address - the Kubernetes address ofservice1orservice1.integration. Using the fullservice.dun.fhaddress would only route of the cluster in order to route back in again - madness!
Blue green no more…
Another change made with the move to Kubernetes was to drop the existing blue / green deployment and replacing that with the Kubernetes rolling update deployment strategy. We could have gone down the blue / green route, but it would have meant that the resources needed for a service would double (one set of pods for the blue colour and another for the green colour.) But, more importantly, it wasn’t actually required.
Blue / green in the old deployment system allowed us to verify that updates to a service were performing as expected by deploying the recent updates to the offline (backstage) colour, testing against the backstage and, if everything worked, flipping the blue / green colours in Consul.
In Kubernetes, we could achieve the same result by using the rolling deployment strategy. For example, let’s assume that service1 has 4 pods running in Kubernetes and we want to deploy a new version. When we deploy the new version, Kubernetes will terminate one of the existing pods. Routing to the other three pods will still work as normal, so our service is up and available, albeit with one less pod. A new pod is created with the latest version of service1. If it passes all its health checks, then the new pod is added to the service endpoints and another of the older pods is terminated and the process repeats until all pods have been updated.
If the new pod doesn’t pass its health checks, then the deployment is stuck and nothing else happens - the existing pods are still alive and the service is still responding to requests. We detect a stuck deployment and issue a rollback - the new pods are deleted and a new pod is created with the previous image (version) of the service and everything is restored back to its state before the deployment began.
Our deployment scripts actually use Helm to package and manage our deployments, including rollback of stuck deployments.
Rollout to production
By the end of August 2018, all microservices had been migrated across to our staging Kubernetes cluster and Virtual Machine infrastructure (for those microservices) had been decommissioned. But, this was just our staging cluster - the live site was still being serviced by the VMs with blue/green deployment. It was time to move into production.
We provisioned a Kubernetes cluster with:
- 1 control plane (master) node: 8GB RAM and 4 CPUs
- 8 worker nodes: 32GB RAM and 16 CPUs
The specifications for the cluster were pretty much double that of the specs we used for the staging cluster. The Kubernetes metrics produced for the staging cluster also guided us in estimating resources required for the worker nodes. (The worker nodes are also virtual machines, so changing memory or CPU is trivial). At the time of writing, CPU usage across the cluster is 11%, memory is 30%, so we have a lot of capacity in the cluster. e.g.: We can easily drain a worker node (move the pods to another node) in preparation for maintenance on the node.
Once again we performed a staged migration of services into Kubernetes, updating the deployment scripts to deploy the microservice into Kubernetes and the old VM/blue/green infrastructure. Traffic was routed both to Kubernetes and the VM infrastructure. Once we were happy the microservice was stable in Kubernetes, we decommissioned the VMs for the microservice and routed all production traffic into Kubernetes. We’d already been through this process a few times before when migrating to the staging cluster, so the migration to production was pretty straightforward and pretty painless.
By the end of October, all of the microservices were migrated across to the production Kubernetes environment and the vast majority of the older VM infrastructure was gone. :grin:
A quick time line of events showed the fairly rapid progress we made to using Kubernetes to manage our deployments and production traffic:
- Mar - Apr 2018 - Investigation into distributed tracing tools and the agreement to move ahead with Kubernetes/Istio
- May 2018 - K8s provisioning scripts created and the Kubernetes staging cluster created
- Aug 2018 - All microservices migrated across to the staging cluster
- Oct 2018 - Production cluster created, all microservices migrated to production cluster.
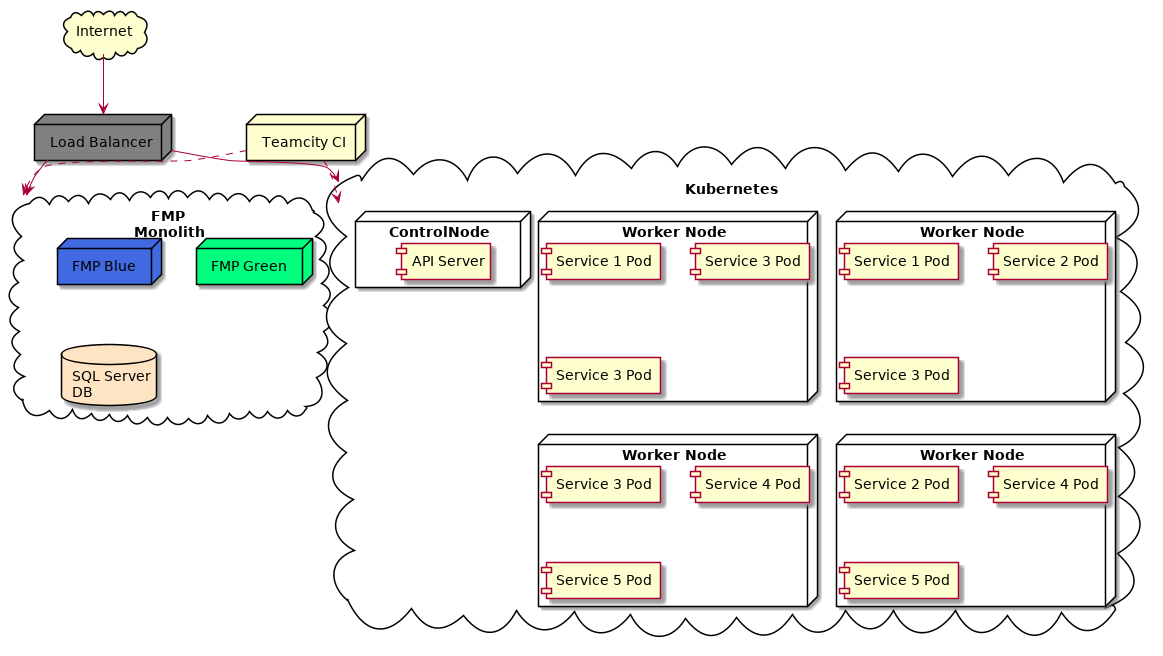
By this point things were looking pretty good - we could automatically autoscale services when needed, production infrastructure was greatly simplified (8 worker nodes rather than 100’s of VMs), we started to leverage goodies like Prometheus metrics and alerting for services. At this point, our infrastructure looked like this:

We still have our C#/.Net stack - bits of that are still serving production traffic. Most of the traffic is served via Kubernetes (8 worker nodes rather than the four in the diagram) with service pods running on a variety of worker nodes for redundancy. Most services have at least 3 pods to ensure uptime should a worker node become unavailable. Critical services have auto scaling to ramp up the number of pod replicas should we need it.
The only problem with the above diagram is that we have a single point of failure with the master node. How we migrated to the high availability Kubernetes is the subject of the next post.